Dashboard
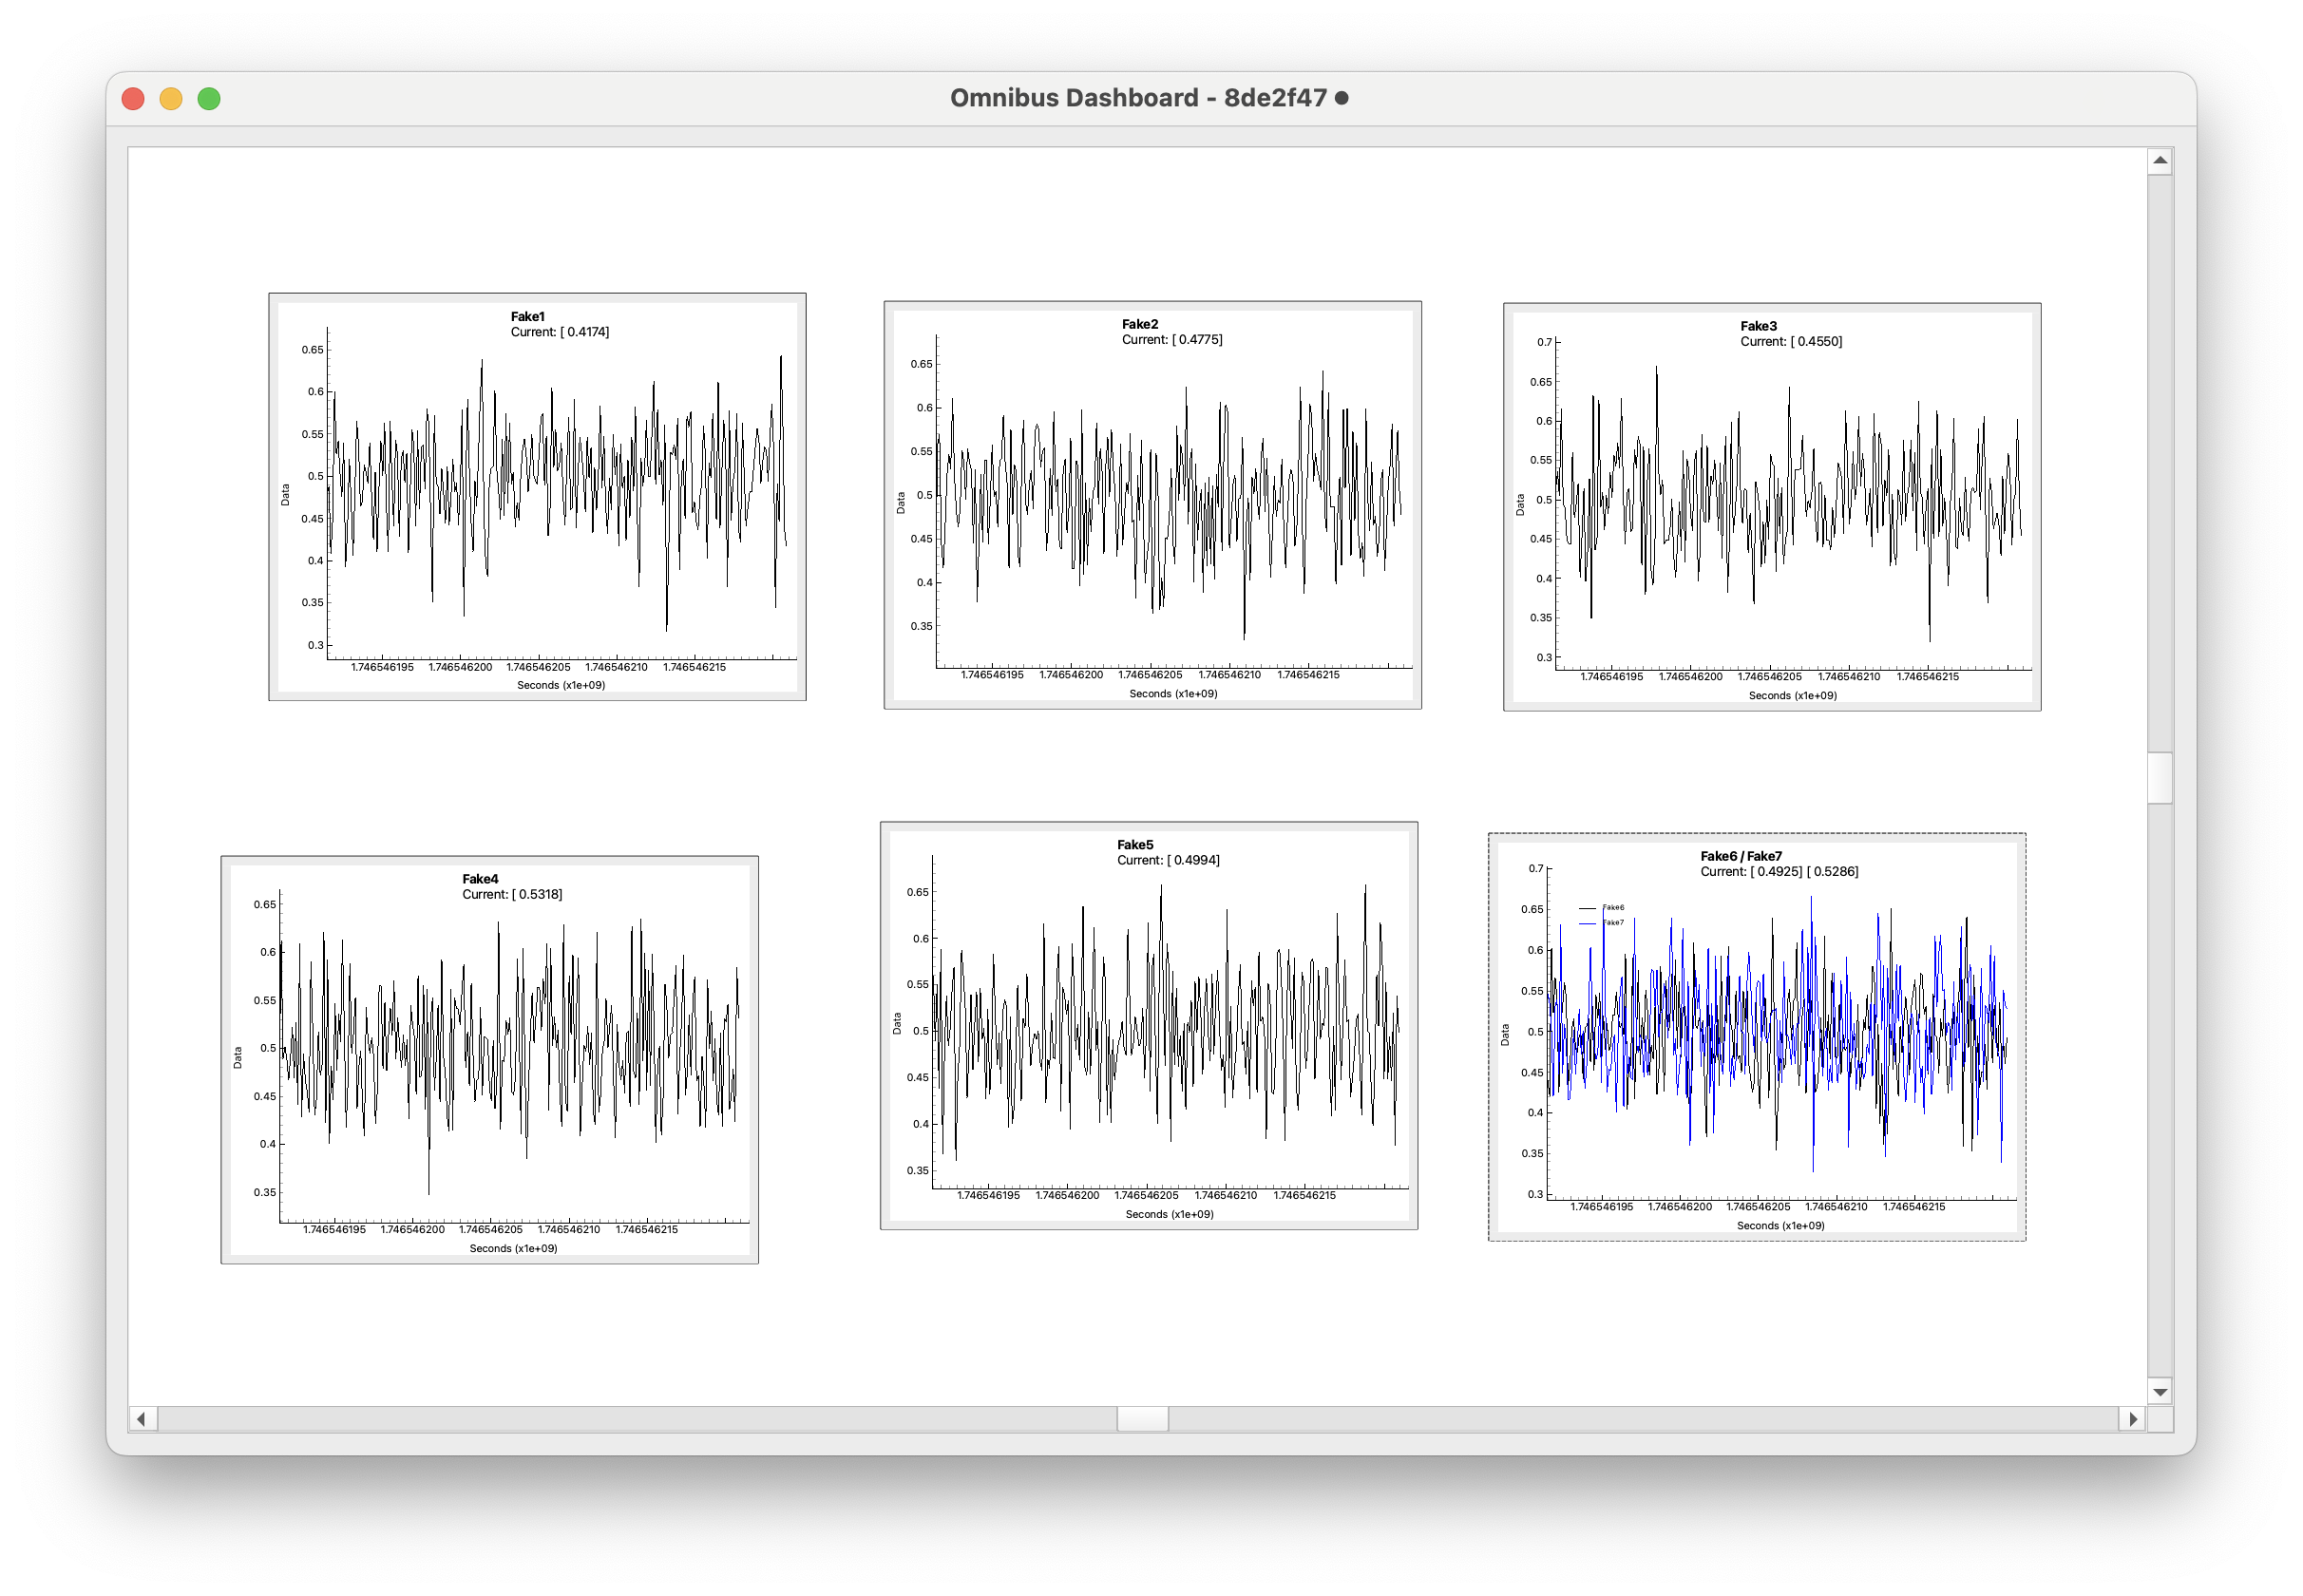
The Dashboard is a crucial sink in the Omnibus system. It is a Qt-based GUI application that provides real-time visualization of data from the ZMQ network using various plots.
Key Features
User-friendly interface: Easy to use and intuitive.
Real-time monitoring: Displays live data from multiple sources and channels.
Supports multiple data types: Monitor data from GPS, IMU, DAQ, and other sensors.
Flexible visualization: View data from different sources and channels simultaneously.
The dashboard is designed to help users efficiently monitor and analyze data from the Omnibus system.
Getting Started
Clone the repository and install dependencies.
Start the dashboard with:
cd sink/dashboard
python main.py
The GUI will launch, displaying the main window with various plots.
It will automatically connect to the ZMQ network and start receiving data.
To add an item to the dashboard, use the menu bar: Add Item → select the desired item.
Note
The title bar of the Omnibus PyQt Dashboard displays a hash representing the current Git version (e.g. 8de2f47) of the Omnibus. Users should take note of this hash, as it is useful for debugging and ensuring consistency between the running dashboard and the codebase version.
Developer Documentation
This section provides technical details for developers who wish to extend or maintain the Dashboard.
Dependencies
See requirements.txt for a list of required Python packages.
Architecture Overview
Main Window: Initializes the GUI and manages layout.
Data Receiver: Listens to ZMQ sockets for incoming data.
Plot Manager: Updates plots in real time based on received data.
Module System: Each feature is encapsulated in a module for easy extension.
Modules
The Dashboard is built with a modular architecture for maintainability and scalability. Each module handles a distinct responsibility, keeping the codebase organized.